




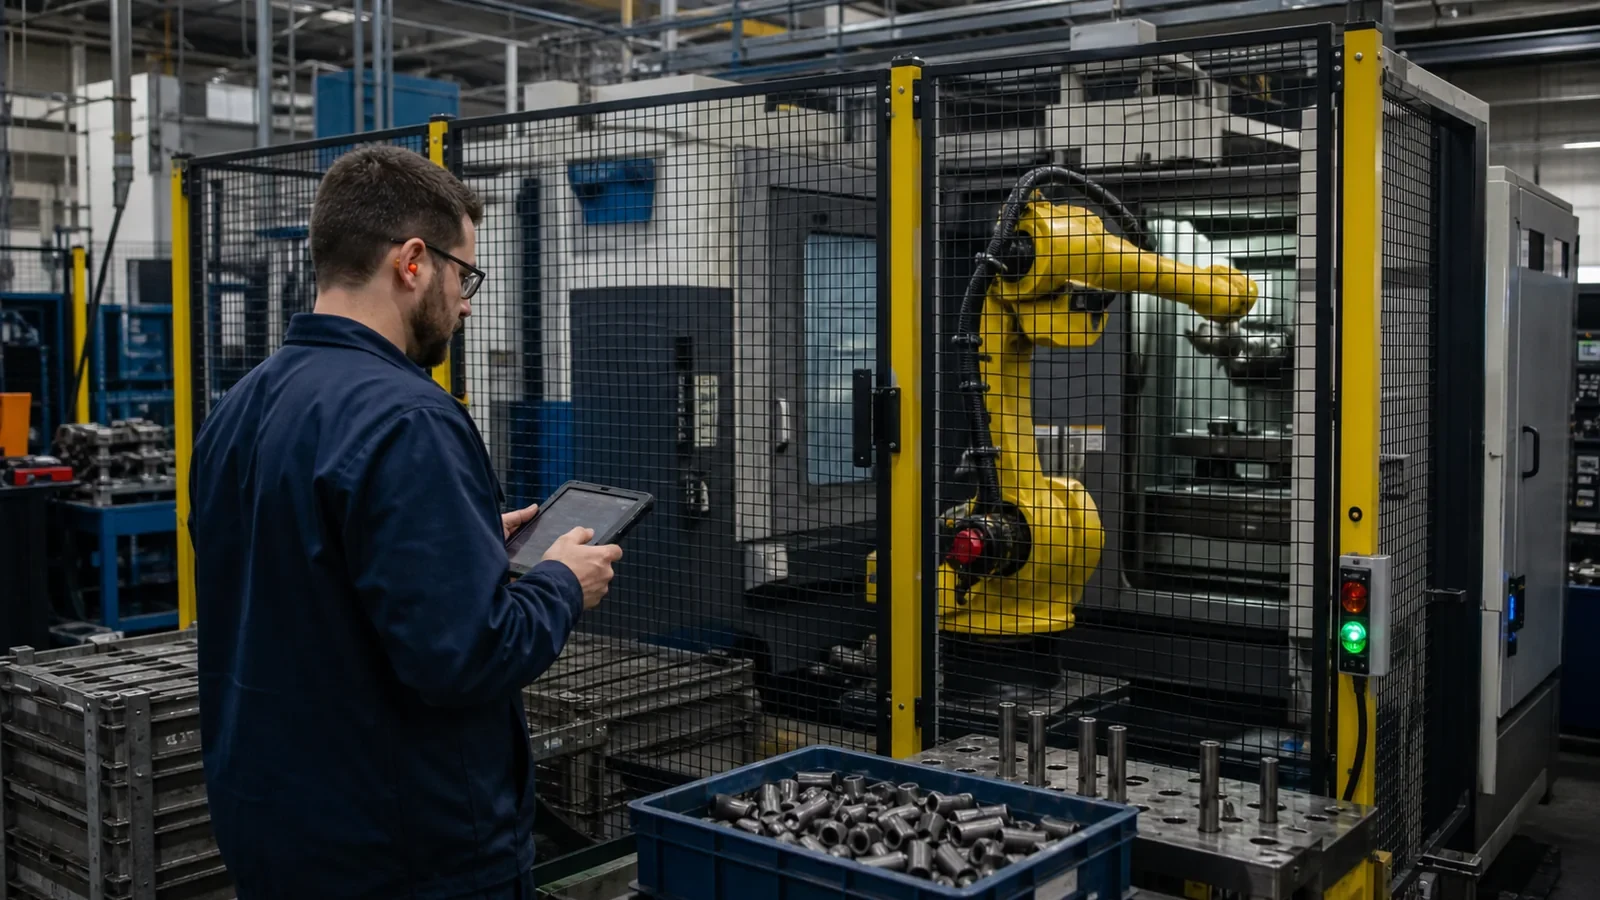
Production automation pays off when the annual cash benefit that can actually be realised covers the full installed and operating cost within the company’s required return. The calculation must include integration, commissioning, downtime, training and support — and it must not count released capacity as revenue unless demand exists to use it.
| Core calculation Simple annual ROI = annual net cash benefit ÷ total installed investment. Simple payback = total installed investment ÷ annual net cash benefit. Use NPV for the approval decision because it accounts for the timing of cash flows; use payback as a risk and liquidity indicator. |
First decide whether the process is a good automation candidate
A process can be technically automatable and still be a poor investment. The strongest candidates combine repeatable work, stable inputs, measurable losses and enough operating volume to use the equipment. If the product changes every few weeks or upstream variation is uncontrolled, standardisation may create more value than a robot.
| Signal | Favourable evidence | Warning sign |
| Volume | Sustained demand and high equipment utilisation | Benefits rely on an unconfirmed sales forecast |
| Process stability | Known cycle and controlled inputs | Frequent manual recovery and undocumented variation |
| Quality | Defects have a repeatable mechanism | Automation would reproduce an unstable process faster |
| Labour | Time can be redeployed or vacancy avoided | Headcount saving exists only in the spreadsheet |
| Safety | Exposure can be engineered out | New guarding or maintenance access creates another hazard |
Build the investment from total installed cost
Request a cost breakdown and name the owner of every excluded item. A low equipment quote can become an expensive project once tooling, conveyors, safety systems, controls changes and production trials are included.
| Cost category | Examples | Timing |
| Equipment | Robot, machine, vision, tooling, guarding | Initial; tooling may recur |
| Integration | Controls, MES/ERP interfaces, engineering | Initial and at major changes |
| Site work | Power, air, foundations, layout, utilities | Initial |
| Commissioning | FAT, SAT, trials, scrap, production downtime | Initial/ramp-up |
| People | Training, standard work, supervision, maintenance skills | Ramp-up and recurring |
| Operation | Service, spares, licences, calibration, energy | Annual |
| Contingency | Known uncertainty and residual scope risk | Initial reserve |
Convert operational improvements into cash benefits
Start with physical quantities, then apply an agreed financial value. This prevents the model from hiding optimistic assumptions inside one large annual saving. Finance should confirm whether each benefit changes cash, avoids a future cost or merely improves a non-financial KPI.
| Benefit | Evidence needed | Conservative treatment |
| Labour | Hours removed, shift pattern, redeployment plan | Count only vacancy avoidance, overtime reduction or real redeployment |
| Capacity | Bottleneck output and demand | Value only saleable contribution or avoided external capacity |
| Scrap/rework | Baseline loss by defect and material | Use good-unit improvement net of new rejects |
| Downtime | Lost contribution at the true constraint | Do not value every machine minute as a sale |
| Safety | Exposure and incident pathway | Report separately unless an approved financial method exists |
| Working capital | WIP/inventory reduction and carrying cost | Use financing/carrying impact, not full inventory value |
Worked automation ROI example
Assume a manufacturer is considering an automated loading and inspection cell. The figures below are illustrative and exclude tax and depreciation. The company should replace them with its own discount rate, tax treatment and cash-flow timing.
| Item | Annual or one-off value | Basis |
| Total installed investment | €240,000 | Equipment, integration, site work, ramp-up and contingency |
| Deployable labour benefit | €62,000/year | Vacancy avoidance and overtime reduction |
| Scrap and rework reduction | €24,300/year | Measured defect volume × avoidable cost |
| Saleable throughput contribution | €30,000/year | Only output supported by demand |
| Gross annual benefit | €116,300/year | Sum of validated benefits |
| Support, spares and licences | €18,000/year | Recurring operating cost |
| Net annual cash benefit | €98,300/year | Gross benefit minus recurring cost |
The simple payback is €240,000 ÷ €98,300 = 2.44 years. The simple annual ROI is €98,300 ÷ €240,000 = 41.0%. At a 10% discount rate, five equal year-end net benefits produce an illustrative NPV of about €132,600. NPV is positive, but the decision still depends on ramp-up, residual value, tax, cash-flow timing and whether the benefits have accountable owners.
Test the business case with sensitivity, not one forecast
| Scenario | Installed cost | Annual net benefit | Simple payback |
| Optimistic | €216,000 | €110,000 | 1.96 years |
| Base | €240,000 | €98,300 | 2.44 years |
| Downside | €288,000 | €75,000 | 3.84 years |
If management requires payback within three years, a €240,000 project needs at least €80,000 of annual net benefit. That break-even threshold is often more useful than debating a single forecast: the team can ask which operating conditions would push the project below it.
Run separate tests for lower volume, slower ramp-up, higher integration cost, lower labour capture, unplanned support and a shorter useful life. Do not combine every downside into one dramatic case only; identify the variables to which the decision is most sensitive and assign an owner to reduce each uncertainty.
Write acceptance tests into the purchase decision
Financial approval should not end at the purchase order. Link supplier payment and project closure to measurable acceptance criteria. Factory acceptance testing (FAT) checks the system before shipment; site acceptance testing (SAT) checks it after installation in the real environment.
| Acceptance area | Example measure | Evidence |
| Cycle | Sustained rate over representative products | Time-stamped run report |
| Quality | First-pass yield and false reject limit | Approved sample and inspection record |
| Availability | Defined run time without supplier intervention | Downtime log with reason codes |
| Safety | Risk assessment actions closed | Signed validation and training record |
| Recovery | Documented restart and manual fallback | Operator demonstration |
| Data | Required production and quality records exported | Interface and traceability test |
Automation investment checklist
- The current process, volume, losses and bottleneck are measured.
- The full installed cost includes integration, site work, downtime and contingency.
- Labour benefit has a specific redeployment, vacancy or overtime mechanism.
- Capacity benefit is supported by demand and contribution margin.
- Recurring support, licence, energy and maintenance costs are included.
- Payback, NPV and downside sensitivity meet the company’s thresholds.
- FAT, SAT, safety, quality, cycle and recovery criteria are contractual.
- A named owner will verify benefits after three, six and twelve months.
For a broader approval framework, including alternatives, supplier risk and stage gates, see How to Evaluate an Industrial Investment Project Before Approval. If the proposed cell relies on machine vision or predictive models, apply the data and error-cost tests in AI in Manufacturing before treating the AI benefit as proven.


[…] Test a downside case. Reduce adoption, performance and volume. Extend ramp-up. Increase support cost. If a small change destroys the return, management needs a staged commitment or better evidence. For a fuller capital review, use where AI in manufacturing works and what can go wrong; for lifecycle comparison, use a practical production automation ROI guide. […]
[…] return, management needs a staged commitment or better evidence. For a fuller capital review, use a practical production automation ROI guide; for lifecycle comparison, use which manufacturing processes to automate […]
[…] Does a Manufacturer Need?Cobot vs Industrial Robot: Costs, Applications and Selection CriteriaWhen Does Production Automation Pay Off? A Practical ROI Guide […]
[…] training, production interruption, spares and recurring support. InduVista’s guide to calculating production automation ROI provides the full […]
[…] which has value only if demand or another bottleneck allows the factory to use it. This is why automation ROI evaluation should test output, downtime and demand sensitivity, not just purchase […]